For this module I was given the option to choose one out of four themes, I chose theme titled 'Just Whistle'. Just Whistle is a project based on sensory engagement and the Haptic. I chose this brief as the subject is something I am very curious about and found very interesting after the research I done through the essay I wrote.
I will begin this page with an explanation as to what sensory engagement and the haptic is, and then provide some examples to show a better understanding of what this page and project is all about.
Further down the page I will show my concepts, inspiration, experiments and at the very end, I will show my final outcome.
Sensory engagement and the Haptic is the practice of conveying information to people in the world through physical interactivity. This can mean a number of things because the world is becoming smaller by the day due to the evolution of technology. The primary concept behind sensory engagement and the haptic is to engage users by inviting them to become part of what they are viewing. This can be done by asking users to interact through gestures, through speaking and listening, through listening and reacting, there are a growing number of ways in which people interact with the world around them. But again, the idea is to invite users to join in with the world, be a part of it rather than a spectator.
In regards to forms of interactivity, through sensory enagement and the haptic, there are many concepts, exhibitions, games, installations, videos, and the list goes on. Sensory engagement is when the user interacts through the use of their natural senses, becoming a participant rather than a passer by. The Haptic is when the user interacts through touch and information being conveyed becomes something they have control over, making them a necessary part of the generated information.
Sensory Engagement and the Haptic
Some Examples
This is an interactive installation called 'post-it notes for neighbours', where people living in the same neighbourhood are invited to anonymously leave information about their house on the post it notes. Information left on the notes where things like, how long they have lived in the house, how much is rent or mortgage etc. This type of interactive would come under Haptic, as it involves touch through writing.
ACCESS is an an interactive installation that lets web users track anonymous individuals in public places, by pursuing them with a robotic spotlight and acoustic beam system.
Golan Levin
Through research I came across Golan Levin, who describes himself as a developer of artifacts and events, that explore reactive expression. I found his work very creative and inspiring. I have given three examples of his work on this page that have inspired me and the work I intend to design.
The video on the right is by far the most inspiring interactive installation by Golan Levin. I find it inspiring because he has created an interactive project which invites the user to participate and interact in various ways, through sound, through gestures and through movement.
If you would like to find out more about this installation, click on the title below and you will be redirected to the project page on Golan Levins website.
Messa
di
Voce
This video demonstrates visualization of audio input again. However, this installation doesn't use shapes or graphics, it simple copies the words your speak and depending on the level and speed you say it, depends on the size, shape and speed the words appear.
Not only does the installation invite the user to interact through sound and speech, it also allows others to interact through gestures. The user can move the words being created by other users, through gestures shown by their shadow from the projector behind them.
This is another installation where user interact through sound input. However, in this examples, the users are provided with glasses with allow them to visualize the sound they input, in augmented reality.
Messa
di
Voce #2
Hidden
Worlds of
Noise & Voice
Experimenting
with audio input in AS3
After researching and finding inspiration from creatives like Golan Levin, I decided to start experimenting with sound. I had never used AS3 (ActionScript3) before and found the idea of learning the language quite daunting at first. However, I was excited about learning how to visualize audio input in AS3 and even more excited about making the visualization interactive.
As I have never used AS3 before, I need to start off with the basics. I went to Adobe's website, used the help pages and also searched the forums for anyone else who may of been a beginner and wanted to know about audio input in flash.
Concept - Noise Pollution
My concept is to visualize conversations, various tones of voice in the different conversations. The initial idea is the more people in the space, the more graphical and busy the installation becomes.
My idea is to capture audio and visualize all of the audio in various graphics on a wall(s). Rather than being an exhbition, I would have the installation in a busy, public are, maybe a coffee shop, bar smoking area etc.
Below is a quick sketch that I drew to quickly visualize what and where an interactive installation like this would go.
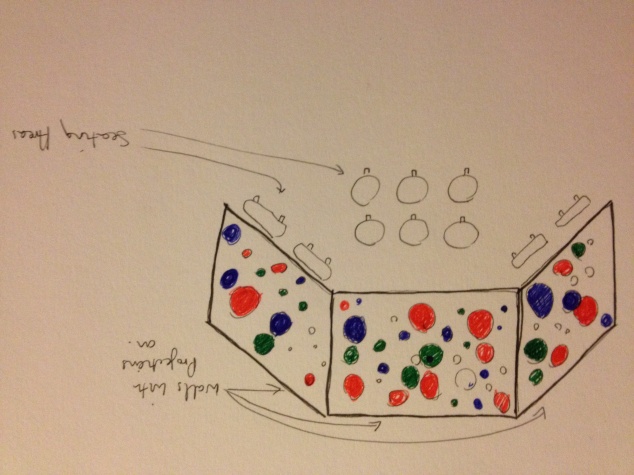
On the right is a quick sketch of the concept I have. The idea is that the installation works inside a public space, where people regularly interact, chat, gossip, meet up etc. The reason why it will be placed in a busy, open, public space is so that there is as much interaction as possible. The more people that are in the space, talking, laughing and shouting, the more interactive the installation will become. The less people there are and the quieter it becomes, the smaller and less active the installation will be.
The aim of the interactive installation is to show how noisy people actually are when drinking, celebrating, chatting, laughing etc.
Now that I have my concept and the basis of where to start, I am going to begin experimenting in flash to achieve the final outcome.
The above code, is the code used in order to retrieve input from the microphone.
As you can see, this is the previous code as before. However, in this screen shot you can see 'import flash.media.Microphone;'. This happens when you press enter after entering the code. It means that Flash has acknowledge your request.
This is the code needed to request users permission when accessing the Microphone.
This is the code to reduce the echoing sound through the speakers when the audio is being input through the mic. Its doesn't completely eliminate the echo, but it does reduce it.
This code dictates where the activity on the stage will go. Sw = Stage Width and Sh = Stage Height. The '/2' means the stage width and height divided by two, so that would mean the activity will be in the center of the stage.
This code sets a place for the microphone data to go, the first code is the 'Event Listener' which 'listens' out for audio data. The second code, sends the data to the stage.

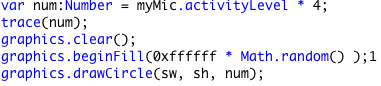
This is the part of the code which turns the data into a visualization. The 'activityLevel' dictates how much data is taken from the microphone - from my understanding it is how sensitive the microphone input is. The higher the level, the more sensitive and more input the microphone is.
'graphics.clear' dictates whether the visualizations flicker on the stage or pile up and overlap each other.
'graphic.beginFill' fills the graphics being produced by the audio input, you can change the colours by editing the colour code '0xffffff' to the specific colour you want, or you can do as I have done here and apply the code '* Math.random' which makes the colour random.
'graphics.drawCircle' is the code in which takes the audio data and visualizes it in a circle. You can change the circle to other shape by changing the code to 'graphics.drawRect' etc.
Experimenting Further
After working out and understanding the basics of capturing and visualizing audio in adobe Flash, I then began experimenting with the code to get a better understanding of how the code works and to push my concept to a more finished, working product.
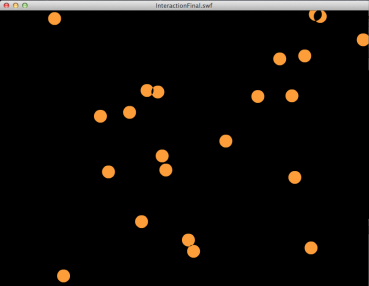
The code shown on the right is an experiment with the visualization of the audio data. Rather than having the circle (which is used to visualize the audio data) flashing alone in the center of the stage, the use of '* Math.random' make the position of the visualization random, so when date is sent to the stage it appears randomly around the space.
Below are three screenshots taken when testing the flash file. As you can see the circle (graphics.drawCircle) appears at random places on the stage, dissappears and then reappears elsewhere on the stage.
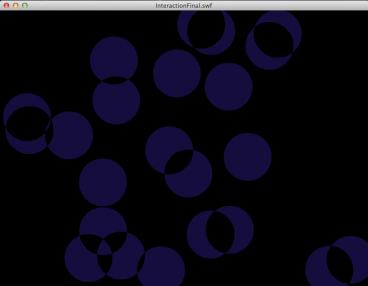
The code shown on the right is an experiment with the visualization of the audio data. Rather than having the circle (which is used to visualize the audio data) standing alone in the center of the stage, the use of '* Math.random' makes the position of the visualization random, so when date is sent to the stage it appears randomly around the space.
Below are three screenshots taken when testing the flash file. As you can see the circle (graphics.drawCircle) appears at random places on the stage, just like the code from the previous experiment. However, I have stopped the graphics from clearing after each bit of audio date, and it has given me this effect.
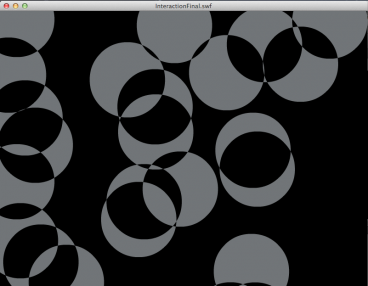
I started playing around with the code more and experimenting with the activity level, the clear and unclear graphics, and the amount of circles used to visualize the audio date. In this example the activity level is five, which is why the circles have come up so big and I have cleared the 'graphics.clear' code so that the visualized data stay on the stage rather than disappear after the data has finished sending.
The image on the right is the out come of this experiment. Although it looks nice and may be an interesting thing to look at, there will be no change after enough noise has been generated, because the circles will just keep piling on top of one another.
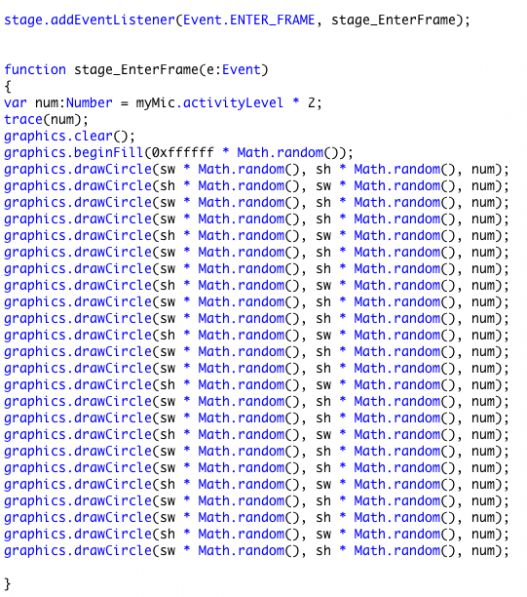

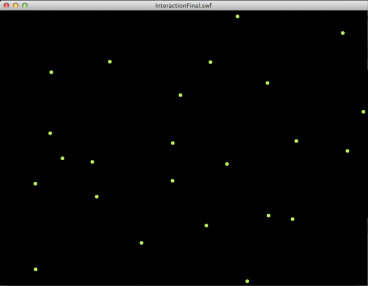
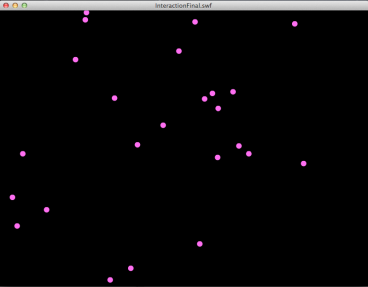
This is the code I have used for the final product. It consists of an activity level of 2, the graphics.clear is active and will remove and then refresh visualized data that is no longer being picked up. I have also chosen to include twenty eight 'graphics.drawCircle' code, because I want the interactive walls to come alive with colours when the environment becomes too noisy.
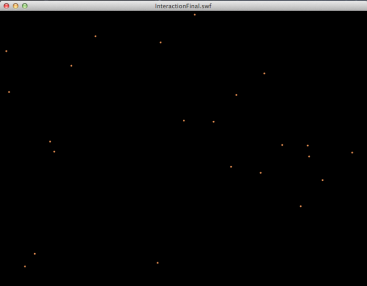
Here are some screen shots of the final interactive installment. Unfortunately, due to the speed of the audio data and the speed of the visualizations, you can not get a great idea of how it works and whether it works.
However I have put the flash and SWF file on a disc and you can test the interactive installment out yourself.
When viewing and interacting with the work on the file, please remember that the installation is designed for very busy, open, public spaces, like smoking areas in bars, inside a central London coffee shop etc. A place where there are a number of conversations going on between various groups of people. The aim of the interactive installation is for people to be comfortable in a familiar place, with friends, colleagues or family, talking and socializing as they usually are. The walls will only come alive when people begin talking, the more people that are in the environment, the more interactive the wall becomes. The busier and louder the environment gets, the big and more active the wall will get, until the people inside the environment realize that it is their noise pollution, trying to speak over one another that is causing the wall to come alive.
