Throughout the semester the class participated in various workshops. The workshops covered included an introduction to Pachube, Adobe Dreamweaver, Final Cut Pro, Arduino boards and the way in which they can be used. On this page I will be covering the things I have learned through these workshops and how they relate to the Authorship and Interaction module.
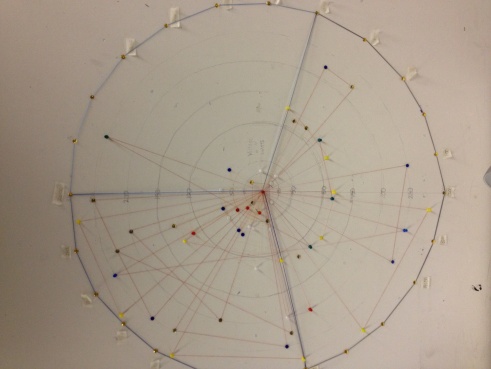
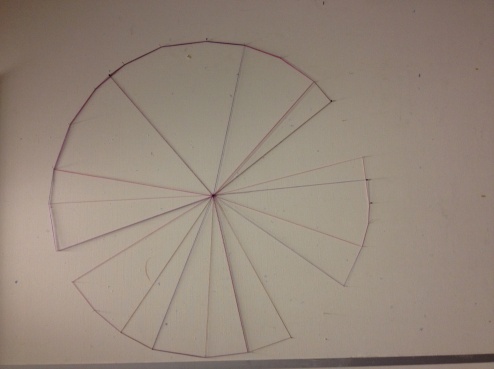
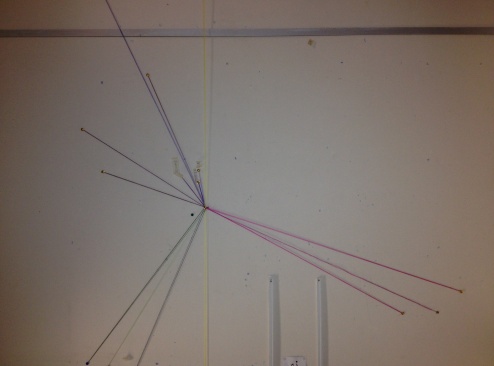
At the very beginning of the module we were asked to collect data on energy consumption in our homes, over a 24 hour period. With the data that we collected we entered data into a website called Pachube (more about Pachube further down the page). After experimenting with Pachube, we then where asked to get into groups and visual our data using nothing but different coloured string. The results of which are on the right hand side of this paragraph.
As you can see from the photographs, each visualization is fairly unique. After each group had completed their visualization, we were asked to switch around and move to another groups visual. This is when things became interesting, because we then contributed to one anothers existing visualization of their data and added our own data on it. Each group done this without pre-existing knowledge of the concept or method's used by the original group which make the outcomes interesting and more fun to work with. The idea was visualization of data and from that, it moved on to participation and interaction through outside users.

Pachube
Pachube is collaborative website, which enables people to send, store and share various types of data.
CLICK HERE TO VISIT THE PACHUBE WEBSITE
Data Gathering - Energy Consumption
Data Visualization
CLICK HERE TO VISIT THE
INFORMATION IS BEAUTIFUL WEBSITE
The above website is a site where information and data is literally turned from being ugly mountains of information into beautiful, understandable, information graphics. The graphics on the site are based on real data, but have used to the date and designed them to be easier to understand by the general public.
CLICK HERE TO VISIT THE
DATA STORE WEBSITE
Data Store
Arduino Board
The Arduino board is a piece of hardware that can be used to interact, retrieve or send date. Many user on Pachube involve Arduino boards in their data collection. For example; some people collect data from their heating consumption at home through the use of sensors linked up with the Arduino board.
Below is a video to demonstrate just how create one can be when using an Arduino board.
The Data Store is a website run by the Guardian new paper. It is where 'Informational is Beautiful' gets most of its data from and a lot of other websites use it as a source of data for studies, information etc.